IELTS Academic Writing Task 1
Pie Chart
Using this 5 steps process to plan and write IELTS pie chart essays will help you to achieve high marks in Task 1:
1) Analyse the question
2) Identify the main features
3) Write an introduction
4) Write an overview
5) Write the details paragraphs
Steps 1 and 2 of the planning process should take around 4-3 minutes. It is essential that you don’t miss these out as they are the key to writing a high-scoring essay.
It is essential that you learn how to do this planning stage properly if you hope to write a high-scoring essay. Ideally, your essay should have 4 paragraphs:
Paragraph 1 – Introduction
Paragraph 2 – Overview
Paragraph 3 – 1st main feature
Paragraph 4 – 2nd main feature
Step 1 – Analyse the question
You must do 3 things:
- Select the main features.
- Write about the main features.
- Compare the main features.
Identify the Main Features
The graphic in IELTS pie chart questions should not be difficult to interpret. Each question has been created to test your language skills, not your mathematics ability.
Pie charts always show percentages or proportions. Apart from that, they are essentially the same as bar charts and line graphs in that they are a way of presenting data visually.
All you are looking for are the main features. These will usually be the easiest things to spot. There will be lots of information in the graphic to help you identify them.
Here are some useful questions to ask?
- What are the units of measurements?
- What are the time periods?
- What can you learn from the title and any labels?
- What is the most obvious trend?
- Are there any notable similarities?
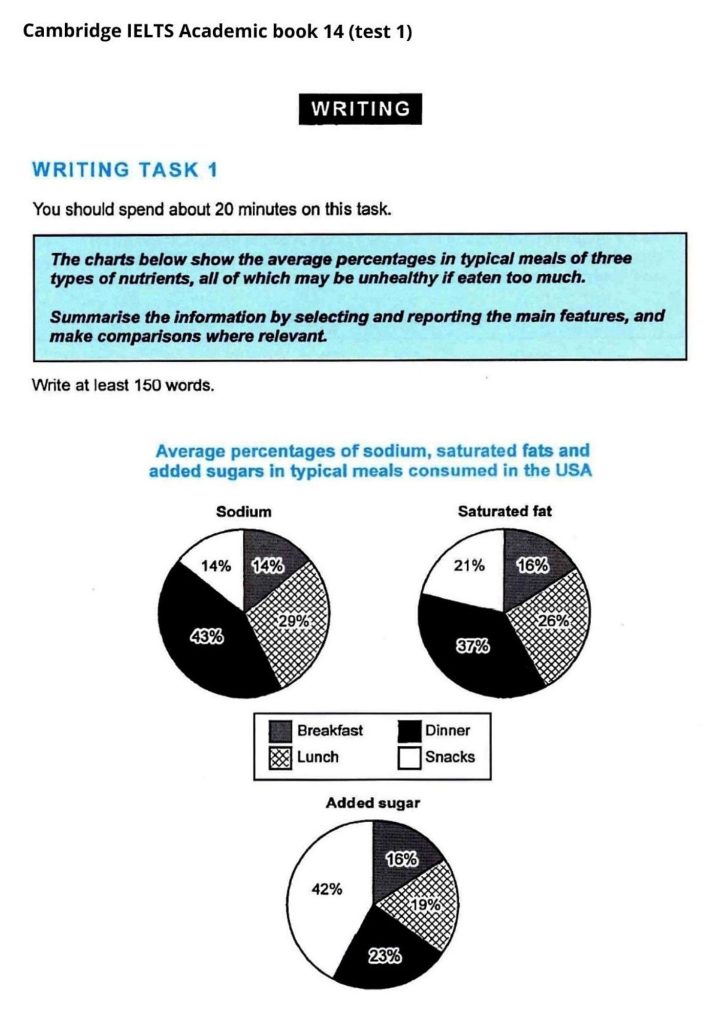
Pie charts generally have titles and labels or sometimes a key instead of segment labels. The key explains what each segment of the pie chart represents
Paragraph 1 – Introduction
In the introduction, you should simply paraphrase the question, that is, say the same thing in a different way. You can do this by using synonyms and changing the sentence structure.
Paragraph 2 – Overview
In the second paragraph, you should report the main features you can see in the pie charts, giving only general information. The detail comes later in the essay. You should also make any clear comparisons you spot. State the information simply, using synonyms where possible. No elaborate vocabulary or grammar structures are required, just the appropriate words and correct verb tenses.
Paragraph 3 – 1st main feature
Paragraphs 3 and 4 of your IELTS pie chart essay are where you include more detailed information about the data in the graphic. In paragraph 3, you should give evidence to support your first key feature. Don’t forget to make comparisons where relevant.
Paragraph 4 – 2nd main feature
In paragraph 4, you should give evidence to support your second key feature. Don’t forget to make comparisons where relevant.
Final tips on describing a pie chart
- Avoid listing every single data point by grouping the data together.
- When analyzing a pie chart, we cannot always give exact details (due to inaccuracies of the chart), so use words around, about and approximately when giving inexact data.
- Give data for each year shown on the chart.
- After you have successfully written out your description with all of the information you wanted to include, go over it and replace some simpler words into more academic ones – this will get you more marks. For example, change “big” to “the most significant”.
- Check that the whole text is free of errors and mistakes.
- Practice with different bar charts to improve.
- Review the superlatives -these are essential if you want to effectively describe the chart.
- The fastest way to improve is to get feedback on your work.