How To Write an
IELTS Multiple Graph Essay
IELTS multiple graph questions are quite common in the Academic Task 1 Writing test. Students often panic when they see these as they are worried about having to interpret two different types of data.
However, as long as you’ve learnt how to write essays on each type of graph, you will have no problem with multiple graphs questions.
A question could include any combination of the following:
- Bar Chart
- Line Graph
- Pie Chart
- Table Chart
The process for planning and writing IELTS multiple graph essays is the same as for any other Academic Task 1 essay.
Here is the 5 steps process I recommend that you use:
1) Analyse the question
2) Identify the main features
3) Write an introduction
4) Write an overview
5) Write the details paragraphs
Step 1 – Analyse the question
The format of every Academic Task 1 question is the same, with the instruction sentence identical in every question.
Every question consists of:
- Sentence 1 – A brief description of the graphic
- Sentence 2 – The instructions
- The graphic – chart, graph, table, etc.
Sentence 2 tells you what you have to do.
You must do 3 things:
- Select the main features.
- Write about the main features.
- Compare the main features.
All three tasks refer to the ‘main features’ of the graphic. You do not have to write about everything. Just pick out 2 or 3 key features and you’ll have plenty to write about.
Step 2 – Identify the Main Features
The graphics in IELTS multiple graph questions should not be difficult to interpret. Each question has been created to test your language skills, not your mathematics ability.
All you are looking for are the main features. These will usually be the easiest things to spot. In most Task 1 questions, you will be looking for two main features in one graph, chart or table. In multiple graph questions, look for one main feature in each graphic.
There will be lots of information in the graphics to help you identify them.
Here are some useful questions to ask? The first question relates specifically to bar charts and line graphs but the rest apply to all graph and chart types.
- What information do the 2 axes give?
- What are the units of measurements?
- What are the time periods?
- What can you learn from the title and any labels?
- What is the most obvious trend?
- Are there any notable similarities?
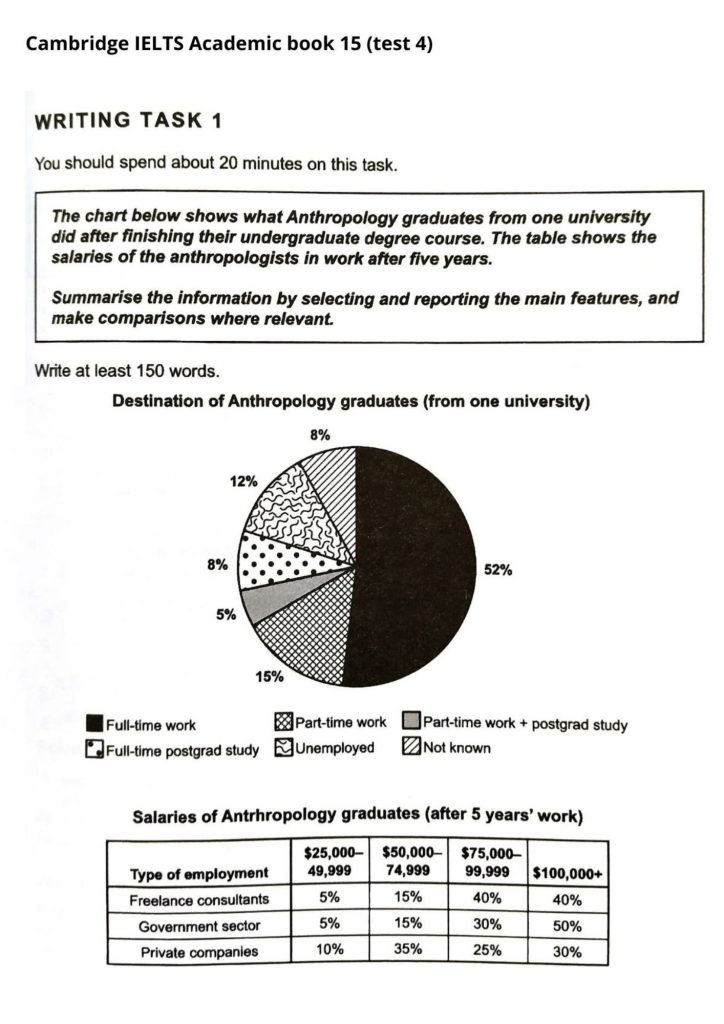
So, what main feature stands out in each of the graphics in our practice question? Here are the pie chart and table again.
Ideally, your essay should have 4 paragraphs:
Paragraph 1 – Introduction
Paragraph 2 – Overview
Paragraph 3 – Details of 1st graph or chart
Paragraph 4 – Details of 2nd graph or chart
Step 3 – Write an Introduction
In the introduction, you should simply paraphrase the question, that is, say the same thing in a different way. You can do this by using synonyms and changing the sentence structure.
Step 4 – Write an Overview (Paragraph 2)
In the second paragraph, you should report the main features you have identified, giving only general information. The detail comes later in the essay. However, with just 20 minutes allowed for Task 1, and a requirement of only 150 words, you won’t be able to include many details.
Now form these ideas into two or three sentences with a total of around 40 words. State the information simply using synonyms where possible. No elaborate vocabulary or grammar structures are required, just the appropriate words and correct verb tenses.
Step 5 – Write the 1st Detail Paragraph
Paragraphs 3 and 4 of your IELTS multiple graph essay are where you include more detailed information about the data in the graphics. In paragraph 3, you should give evidence to support your first key feature.
Step 6 – Write the 2nd Detail Paragraph
For the fourth and final paragraph, you do the same thing for your second key feature.